Introduction
For a brief introduction of the NYC housing landscape, check out the timeline below. This includes policies and challenges in NYC, which situates the conversation about the recent surge in Airbnbs which we will discuss in the following sections.
Airbnb Timeline – Navigating the Housing Landscape
In an era where technology has revolutionized the way we seek shelter, Airbnb stands as a fronting force, offering a wide range of listings worldwide that transform the concept of temporary residences. This platform facilitates the exchange of homes for millions of travelers, by not only promising a place to stay but also striving to provide a genuine home away from home. The Airbnb platform works through the following processes: it all begins with someone who possesses a home or shelter they would like to put for rent. Once registering on the Airbnb platform, they can share the unique qualities of their home, the amenities provided for comfortable travel, and the price range for the value of a stay at their home. Once selected for rental, the homeowners receive a payment for a booked reservation, and then their renters can now enjoy their travel in a home rather than traditional travel accommodation.
Among the most traveled locations, the need for more residences to handle the magnitude of tourism to these places must increase. As more homes turn into properties for renting, what happens to the permanent residents of these locations? What impacts does the loss of permanent homes have on the broader communities and how might this perpetuate the marginalization of certain groups? We sought to investigate these questions and utilize insights from the InsideAirbnb dataset.1 Our dataset was created by scraping actual Airbnb data to provide the most accurate information on community impact: who reaps the benefits and who suffers the consequences?
In searching for the impacts of Airbnb on current systems, we discovered the platform’s effect on gentrification. In our research, we shall examine how the prevalence of Airbnb usage in tourist-heavy locations impacts the permanent communities in these areas, particularly New York City. Our research seeks to understand how gentrification has impacted the geography of affected neighborhoods and whether any meaningful pattern exists—combined with a geographical dataset. In all, our project seeks to humanize the data and shed light on the tangible effects of short-term rentals in the NYC community.
Literature Review
Further studies include those by Stabrowski (2017)2 and Törnberg & Chiappini (2020)3, both of which analyze the impacts of gentrification on local communities. Stabrowski (2017) argues that entrepreneurial and financial motives often overpower insight to what is best for local communities, therefore exacerbating difficulties for those residents. His study specifically analyzes how Airbnbs displace certain demographics in different areas of neighborhoods that were once their own, leading to localized oppression. Törnberg & Chiappini (2020) argues along a similar manner, examining how marketing tactics for Airbnb’s in New York City are part of a larger story of colonial history and racial expropriation. Their research indicates how Airbnb hosts cater listings in black-majority neighborhoods “through a form of colonial discourse: exoticizing difference, emphasizing foreignness, and treating communities as consumable experiences for an outside group” (Törnberg & Chiappini, 2020, p. 553). As such, Airbnb hosts become entrepreneurs and cultural agents of the city by specifically attracting middle class guests into outside communities, thus driving the displacement and marginalization of locals.
Other literature on home-sharing suggests potentially countering views, pointing to the positive impact that Airbnbs can have on local communities. For example, Kadi et al. (2022)4 analyzes how Airbnbs generally promote more inclusive forms of tourism through home sharing with tourists. Nevertheless, the sharing economy of Airbnbs is a fairly recent phenomenon, so there is still not extensive research on the overall positive or negative impact. As such, this is a gap in the literature that needs to be addressed.
Our study aims to examine how the increased prevalence of Airbnbs in NYC may perpetuate gentrification and reinforce the displacement of marginalized communities. It will do so by analyzing existing literature and demographic data to explore this correlation and provide a humanistic lens to the research. Additionally, by limiting our study to focus on New York City, we can examine quantitative, qualitative, and socioeconomic variables that may play a large role in driving gentrification and marginalization. By examining these variables, we aim to highlight Airbnb’s potentially negative effects on local communities, which would give us insight into the disruptive behavior of short-term rentals on a social, economic, and cultural level.
Correlation Between Airbnb Data and Gentrification
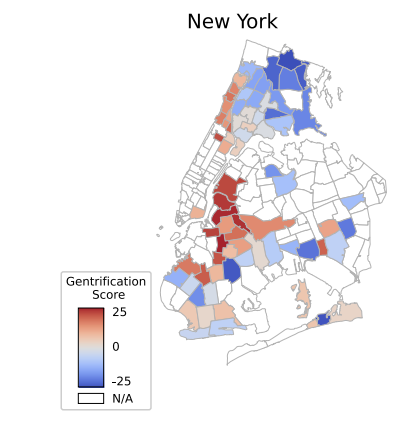

Gentrification Score Between 1998-2002 and 2013-2017 vs. Number of Airbnb Listings in 2013-2019
Our dataset is supported by other research studies, providing evidence for the positive correlation between Airbnb proliferation and gentrification. To begin, there is an existing conversation among scholars that supports the growth of NYC Airbnbs in gentrified or gentrifying areas. Shomik et al. (2021)5 discusses how actively gentrifying neighborhoods have increased Airbnb listings, more reviews, and higher prices. The figure above from their research, Nowcasting Gentrification Using Airbnb Data, a user-generated data analytics study, emphasizes this relationship. As clearly depicted, areas with a high concentration of gentrification are directly correlated to areas with a high concentration of Airbnb listings. As such, gentrification becomes part of this larger narrative based on substantial socioeconomic and functional changes in neighborhoods. Such a culturally apathetic “revitalization” (Shomik et al., 2021, p. 38:1) can be measured through numerous socio-economic variables including age, education level, income, and housing affordability. This is supported by Dudas et al. (2017)6 where the researchers performed a statistical analysis to examine the socio-economic conditions that affect the spatial organization of Airbnbs. The findings suggest that areas with the highest concentration of Airbnbs are “those parts of the city that have a young population, a significant number of housing units, and a high number of points of interest” (Dudas et al., 2017, p. 135). For this study analyzing NYC Airbnb data in relation to gentrification, housing affordability was the primary measure we were interested in.
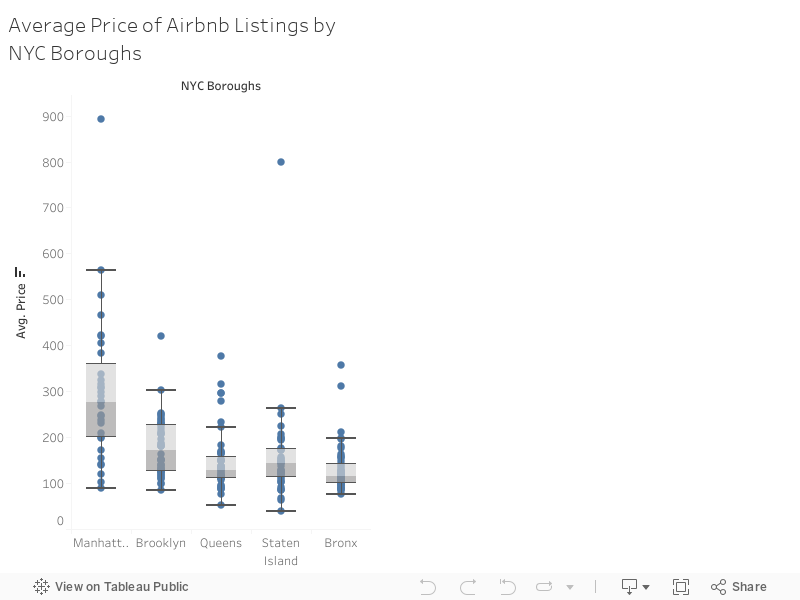
Box Whisker Plot Showing Average Prices of Airbnb Listings by NYC Borough
The visual above is a box and whisker plot that shows the average price of Airbnb listings by NYC boroughs. This is useful for analyzing housing affordability across the five main neighborhood groups. A key takeaway is that Manhattan has the highest median price range, with values ranging from $90 to $562/night. A notable outlier is the datapoint at $892/night, but on average, the median price is $276/night. As Airbnb listings increase the cost of living in these respective neighborhoods, this can have implications on the types of guests that are attracted. For instance, higher prices per night generally attracts higher income visitors. This is supported in Lee & Kim’s 20237 study, which uses a spatiotemporal analysis to examine the economic effects of NYC Airbnbs on rental prices, gentrification, and overall housing value. Assuming gentrification is occurring, NYC would see an influx of higher-income residents and displacement of lower-income residents. This would be measured via a decrease in the number of households in relative poverty, which was supported in the researcher’s findings (Lee & Kim, 2023). Such examples emphasize how Airbnb housing affordability is affecting the overall cost landscape of NYC, as rising prices are attracting higher income residents through a process of gentrification. While most clearly seen in Manhattan, these effects are also occurring in Brooklyn, Queens, Staten Island, and The Bronx. In the next section, we will consider the heterogeneity of Airbnb listings to explore if different types of Airbnbs have varying impacts on gentrification.
Heterogeneity of Airbnb
With proven correlations between short-term rental popularity contributing to restructurings of urban neighborhoods, it is important to consider the multitude of Airbnb types, methods, and business models. Not all Airbnb’s have the same effect on gentrification. Airbnb claims to provide “live like local” experiences for tourists visiting an area (Lee & Kim, 2023, p. 1). However, the unexpectedly fast growth rate of the platform has shifted the focus from local home sharing to a commercial real estate business opportunity. Spatiotemporal research indicates that the impacts of Airbnb on communities differ by the type of Airbnb unit and the type of Airbnb host. For instance, Airbnb listings posted by hosts that own multiple properties and units in New York “cause substantially greater disturbances in terms of rent increase, increase in housing value, and displacement of lower-income households” (Lee & Kim, 2023, p. 2). On the other hand, Airbnbs that are not commercialized, offering single room listings by single-unit hosts, have limited strain on housing supply since they offer a more localized ‘mom and pop’ accommodation experience (Lee & Kim, 2023). These examples highlight the varying impacts between multi-unit and single-unit hosts. The following image shows the spread of commercialized properties across different areas of the city. It shows a higher density of multi-unit hosts in Manhattan and Brooklyn, along with collective higher Airbnb units in these neighborhoods (Lee & Kim, 2023). Considering these neighborhoods are also more tourist heavy, this can reasonably be correlated to the increased proliferation of Airbnb units we see below.
Airbnb Listings in NYC Visualizing Concentrations of Commercialized and Private Host Properties
Entire home listings by multi-unit hosts have the highest impact on gentrification. These commercial units tend to have higher profit incentivization over prioritization of protecting local communities, exhibiting an effect on rent increase along with housing value. Because of the inherent difference in “sharing what you already own and acquiring new properties for short-term rentals,” the magnitude of impact differs based on the heterogeneity of Airbnb type (Lee & Kim, 2023, p. 4). This is proven based on economic indicators of rent, housing value, and average households under relative poverty. Since the type of Airbnb causes differences in impact, varying solutions are required for positive change. In other words, a one size fits all approach will not be sufficient for balancing the positive and negative impacts of Airbnb (Lee & Kim, 2023, p. 10). The following data visualization shows varying ratios between single-unit and multi-unit hosts across different neighborhoods. Manhattan and Brooklyn have the highest amounts of total Airbnb listings, and also the most commercial units. This is also directly supported with the image above, which emphasizes the higher density of multi-unit hosts in these respective neighborhoods.
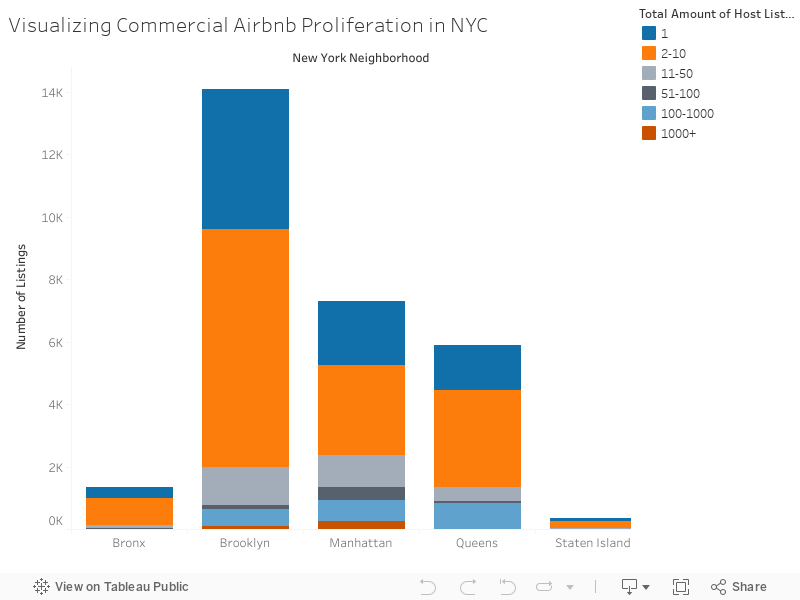
Bar graph showing the amounts of hosts with commercialized property listings, visualizing the amount of multi-property hosts across New York neighborhoods.
Practical Implications
With the imbalanced impact of Airbnb based on host type, neighborhood, and tourist demand, it is important to develop malleable structures and strategies to combat the negative effects of gentrification and limit cultural displacement. Listing variations must be considered in practical implications and future strategy (Lee & Kim, 2023). Research shows that machine learning algorithms and user-generated data is becoming increasingly influential for extracting live information, and in turn generating better predictions and measures of socioeconomic changes occurring in the New York Airbnb infrastructure. Often overlooked, analyzing guest reviews can be an additional useful tool in understanding gentrification patterns. When creating reformed policy in local cultural favor, policymakers should consider insights from Airbnb data in addition to local data sources to generate decisions while recognizing how the gentrification process can be “seen and captured” by guest experiences, despite being a traditionally “hidden and slow process (Shomik, 2021, p. 38:15).” In addition, it should be a collective goal of the city to reduce highly commercialized Airbnb hostings. This benefits both local communities impacted by gentrification, and allows for better tourist satisfaction as Airbnb users typically desire unique local experiences in homey short-term rentals (Lee & Kim, 2023). While locals do benefit from tourism, “negative economic effects affect a greater proportion of the local community,” further emphasizing the need for productive reformative policy (Lee & Kim, 2023, p. 3).
NYC Airbnb Hotspots: Where Entire Home Units Thrive and Why
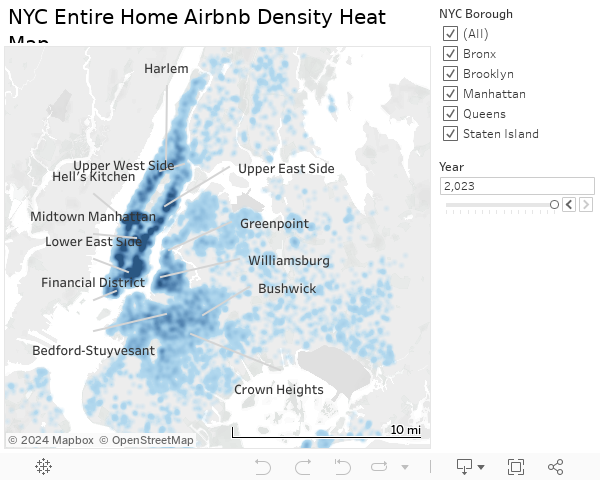
With the understanding that entire home units have the highest impact on gentrification (Lee & Kim, 2023), the density heat map below displays all of the “entire home” Airbnb listings in New York City to highlight their geographic distribution . Inside Airbnb’s NYC data comprises listings scraped as of October 2023, allowing for an up-to-date dataset for visual analysis. Due to the sheer number of listings in New York City, the density feature is an effective way to visualize what areas contain heavier concentrations of entire-home Airbnbs. Darker blue spots represent a high frequency of listings, whereas lighter blue indicates areas with fewer listings. The filters – “NYC Borough,” and “Year” – allow for different analyses. The ‘NYC Borough’ filter allows one to examine borough-specific trends by selecting only certain boroughs for visualization. The ‘Year’ filter – constructed from a parameter that extracts the year when the host of a listing joined the platform – allows for a time-based analysis. This highlights the change of entire home listings throughout Airbnb’s presence in the city. It is important to note that the year filter may not always correspond to when a listing went up, since the field it was extracted from represents the date the host joined the platform. However, the parameter still gives an informative picture of how entire home listings have changed over time in the city.
Spatial Heat Map Visualization of Entire Home Airbnbs in NYC
To interact with the map more easily, we encourage you to view it in full-screen mode.
Hotspots
The density map reveals entire home listing hotspots across neighborhoods in the boroughs of Manhattan and Brooklyn. These boroughs also happen to contain 7 of the 20 most gentrified neighborhoods in the United States, according to RentCafe’s examination of US Census Data (Manskar, 2018)8. In Manhattan, the neighborhoods of Hell’s Kitchen, Midtown Manhattan, the Lower East Side, and the Financial District contain some of the highest concentrations of listings. While smaller in size, other significantly dense spots in Manhattan include the Upper East Side, Harlem, and the Upper West Side. Meanwhile, in Brooklyn, important hotspots include the neighborhoods of Williamsburg, Bushwick, Bedford-Stuyvesant, and Crown Heights, with smaller pockets of hotspots in Greenpoint. For easy identification, most of the “hotspot” neighborhoods have been labeled on the map.
The “Why”
Many of the “hotspot” neighborhoods coincide with some of the most gentrified zip codes in the United States. RentCafe’s evaluation of the US Census Bureau Data reveals that “hotspot” neighborhoods Harlem, Williamsburg, Bushwick, Bedford-Stuyvesant, Greenpoint, and Crown Heights are within the Top 20 spots of the list (Manskar, 2018). This demonstrates a significant relationship between Airbnb short-term rentals and gentrification. Wachsmuth, an Urban Planning researcher, contends that this intersection is characterized by a “rent gap,” in which long-term rentals have the potential to be more profitable as converted short-term rentals in already gentrifying neighborhoods (Wachsmuth & Weisler, 2018)9. The trend of Airbnb listings proliferating in already gentrified neighborhoods is fundamental to understanding Airbnb’s role in disrupting housing dynamics in the city. A study conducted between 2015 and 2017 notes that three “post-gentrified neighborhoods” – Times Square, the Lower East Side, and Williamsburg – had some of the biggest increases in Airbnb listings as a revenue stream from housing (Wachsmuth & Weisler, 2018). Already gentrified neighborhoods are well-suited for Airbnb listings because they tend to have the amenities, access to public transportation, and infrastructure that short-term renters (often tourists) rely on. Furthermore, many of these gentrified neighborhoods are seen as culturally desirable due to their unique character or some sort of historical significance (Wachsmuth & Weisler, 2018). For instance, Harlem- listed above as one of the most gentrified neighborhoods- is renowned for being a hub for African-American literature, music, and art. Tourists and visitors who are drawn to this historical significance may choose to stay at listings in the neighborhood. To summarize, while Airbnb may not be an initial driver of gentrification, it exists and worsens the problem in areas where this transformation has already taken place.
Airbnb Spatial Analysis: Socio-Economic and Gentrification Trends
Building on the earlier section about the heterogeneity of NYC Airbnb listings, this section will dive deeper into the three main types of rental options: (1) Entire homes, spaces where the host is not present in the unit during the guest’s stay, (2) Private rooms, spaces within a hosts home and the host may be present during the guest’s stay, and (3) Shared rooms, spaces where guests and hosts share the same living space (model emphasized by the founders). Analyzing Airbnb data, it will provide insights on how socio-economic factors can shape its spatial distribution.
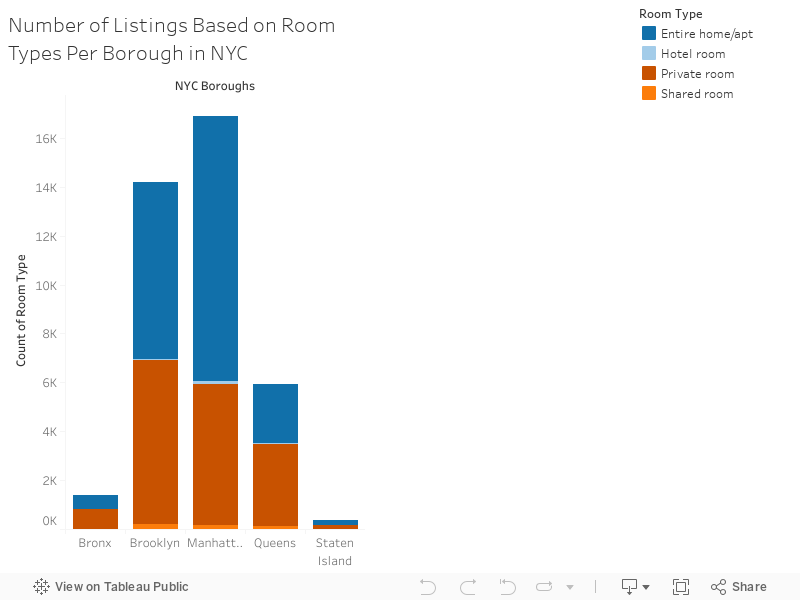
Bar Graph of Listings Based on Room Types
Notably, almost 50 percent of the listings are entire homes and 47 percent are private rooms. Short-term rental replacing longer-term and larger-space housing may indicate a squeeze in New York’s already-limited housing supply. More listings for larger spaces may provide short-term accommodations for higher-income individuals. This is supported by Dudas et al. (2017), where entire homes cost twice as much as private rooms do on average. In turn, this may lead to less housing for lower-income individuals.
Additionally, Dudas et al. (2017) suggests that there is a potential intersection between Airbnb activity and gentrification, as noted that popular Airbnb neighborhoods often coincide with areas experiencing or having undergone gentrification. Such neighborhoods include Chelsea, Greenwich Village, Williamsburg, Greenpoint, and the Lower East Side. The research also suggests that the appeal of Airbnb is particularly strong among the youth population, which indicates a preference among highly educated individuals responsive to new technologies. This may implicitly contribute to gentrification since this demographic’s preference often precedes the transformation of areas into more affluent spaces (Dudas et al., 2017). Furthermore, the correlation between Airbnb prices and socio-economic indicators such as education and household income unveils some sort of nuanced relationship with economic variables. In essence, the findings of this study illuminate the complex dynamics of Airbnb in urban spaces and its connection to broader socio-economic trends.
Ultimately, acknowledging that Airbnbs attract specific communities and guests is essential to understanding how short-term stays can have long-term impacts. Through socio-economic and gentrification trends that support the proliferation of larger-unit Airbnbs and the attraction of higher-income guests, we can begin analyzing the effect this is having on local communities. The next section will analyze this topic in more detail, specifically in regards to how Airbnbs can reinforce the displacement of marginalized communities.
Airbnb’s Marketing Echoing Historical Patterns of Colonialism and Racial Expropriation
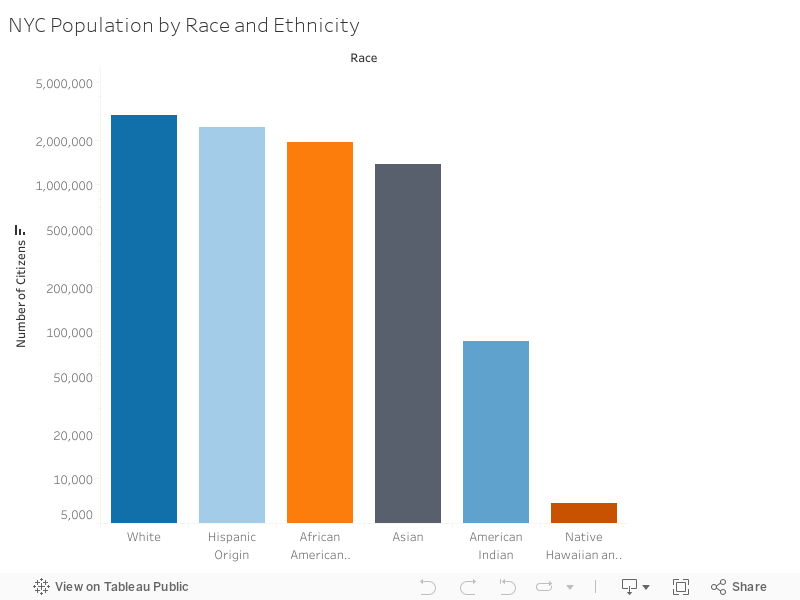
Bar Graph Visualizing New York Population Demographics
The majority of research on Airbnbs has been through an economic lens, analyzing its impact on the economy and role in gentrification. However, Airbnbs also have a significant impact on cultural dynamics since they provide a platform for hosts/entrepreneurs to explore a global symbolic economy. By marketing urban locations to a majority transnational middle class audience, this defines who belongs in certain spaces. As a result, Airbnb listings can reinforce the displacement of marginalized communities.
In the research article, “Selling Black Places on Airbnb: Colonial Discourse and the Marketing of Black Communities in New York City,” Törnberg & Chiappini (2020) analyze how Airbnb marketing tactics in New York City uphold a historical pattern of racial expropriation and exploitation. They do so by employing a computational critical discourse analysis to compare the difference in how Black and White hosts market their Airbnb spaces in Black-majority neighborhoods. They then analyze how guests perceive their consumption experience, providing a holistic view of both the hosts and guests experiences.
To begin, an analysis of White host’s marketing strategies is contextualized via the larger narrative of colonialism. Colonialism refers to the historical practice of dominating territories, exploiting land and resources, and imposing forms of cultural superiority/inferiority. Oftentimes, this favors the colonizer at the expense of the colonized. In the context of Airbnbs, Törnberg & Chiappini analyze how White host marketing strategies are not isolated incidents, but rather uphold the historical echo of colonialism and racial expropriation. They state how White hosts marketing strategies cater to Black-majority neighborhoods “through a form of colonial discourse: exoticizing difference, emphasizing foreignness, and treating communities as consumable experiences for an outside group” (Törnberg & Chiappini, 2020, p. 553). As such, Airbnb marketing tactics in New York City become part of this larger continuum of cultural dominance and power imbalance between White and Black populations. In this case, it becomes clear how White hosts are entering predominantly Black neighborhoods and selling the narrative of colonial conquest as a marketing tactic/form of attraction. This also emphasizes how White Airbnb hosts become entrepreneurs and cultural agents of the city by specifically attracting middle class guests into outside communities, thus driving cultural displacement of the local Black community. This leads to the consumption experience of White guests, who uphold the narrative of White hosts by portraying themselves as “brave White adventurers exploring uncharted territories: glorious conquests no longer over gold and ivory but over sandwiches at a local bodega” (Törnberg & Chiappini, 2020, p. 554).
Overall, Törnberg & Chiappini’s (2020) research supports the narrative of Airbnb marketing strategies upholding colonialism and racial expropriation as White hosts are entering Black neighborhoods and attracting White guests. As such, this is displacing the local Black community, conveying the narrative of White superiority. Not only does this reinforce the Black population as a marginalized group, but it also highlights how gentrification can have significant implications on the demographic makeup of NYC. This is displayed in the visualization above, which shows NYC population by race and ethnicity. Paralleling with the research, it is clear how the White demographic makes up the largest category of NYC residents at 3000K, followed by Hispanic at 2500K, African American at ~1900K, Asian at ~1385K, and then American Indian and Native Hawaiian at much smaller levels. While this graph does not directly imply the causation of gentrification resulting in higher levels of White residents, it does support that White residents make up the largest demographic in NYC at a disproportionately larger interval. Thus, a correlation can be concluded between the recent gentrification patterns attracting higher income White guests, and the overall demographic makeup of NYC. In the next section, we will explore the impact of Airbnbs on other marginalized communities, specifically analyzing the elderly population.
The Rise and Fall of Housing Independence Among Marginalized Groups
The literature supports that the proliferation of Airbnbs in gentrified/gentrifying areas contribute to the shifting of established cultural communities. Despite Airbnbs platform emphasizing ‘live like a local’ (Brenner, 2016)10 , it seems as though the guests have actually taken the place of the locals in the communities that tourists sought to originally experience. According to a study on Airbnb prevalence in NYC, “specific groups such as households with low incomes, renters, and elderly households are likely to be at higher risk of being forced to move because of rising housing prices or landlord tactics” (Cohen & Pettit, 2019)11. Among these at-risk factors, this begs the question: Who suffers displacement the most frequently and how significant of a scale?
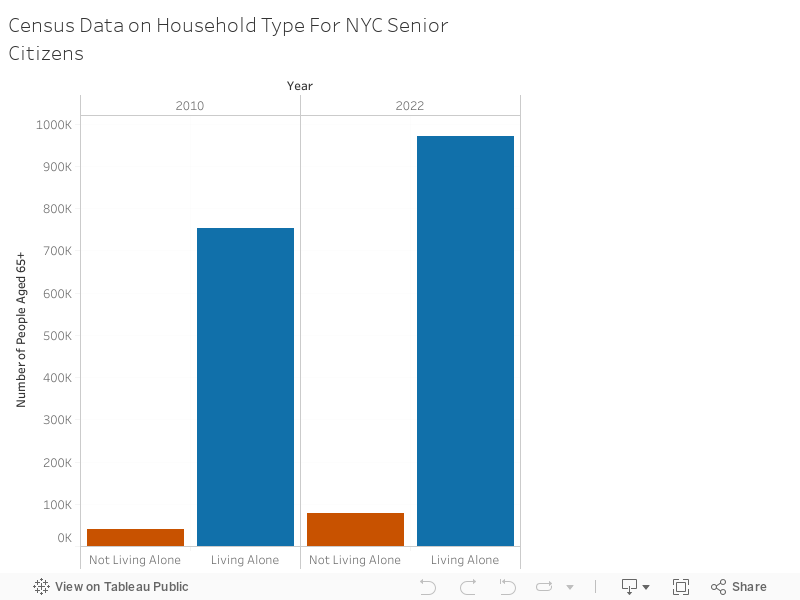
A Bar Graph Showing A Population Comparison of Senior Citizens Who Lived Alone Versus With Other People Between the Years of 2010-2022
Through researching the effects of gentrification and short-term rentals among marginalized groups, senior citizens most frequently have their housing accommodation altered as a result. The two primary data points we analyzed to measure these effects come from household occupancy rates. On one hand, senior citizen occupancy rates have increased for those living alone and on the other, the occupancy rates of elderly citizens being forced to move in with other family members has also increased.
Beginning with those living alone, the visualization above shows the proportion of senior citizens living by themselves vs. not living by themselves between 2010-2022 in NYC. Not only does living alone constitute a much greater percentage than not living alone, but we can also see how the number of those living alone has increased. For example, from 2010 to 2022, this number has grown from ~750,000 to ~970,000 senior citizens. Comparing that statistic to those being forced to live with other family members, this has also increased from ~40,800 to ~78,600 senior citizens (New York City QuickFacts, 2022)12. In both cases, we can see how these numbers have grown over the years. While many attribute these changes to old age and care needs, this can be a problematic assumption considering our overall life expectancy has grown. This can be attributed to factors such as medical breakthroughs and better technology, which allow us to live longer and healthier lives. Therefore, to better understand these statistics and rising numbers between the percentage of elderly living alone and moving in with family members, we can consider analyzing the economic landscape of the housing market.
One possible explanation for this trend, as supported by our research, is gentrification and increased market prices. This can cause the elderly demographic to stay in their homes due to the lack of affordable housing elsewhere and the loss of rent-regulated accommodations. Senior citizens have a fixed-income basis, therefore, they cannot meet the increasing demands of landlords who are increasing property prices due to gentrification. As such, this can correlate to the increased number of elderly living alone, as they stay in their original properties.
This connection is also supported by New York Census data on senior citizens, where elders living alone have skyrocketed between the last two census collection dates. This subset of the elderly population who do not have families, also do not have the current arrangements or resources to move out. Considering that new housing often is not available for rent, programs to help pay for housing generally do not exist, and the overall housing landscape is increasing, this results in them staying where they are. In addition to their marginalized identity in their low-income, elder, and renter statuses, many must continue to fight for their right to stay in their houses as they have no other choice. If they cannot afford that, then they are forced out of their community, and with that, their community leadership positions and independence.
Those with no option but to live alone must also face the pressures of moving out to transform their homes into higher-priced rental units. For those who face gentrification head-on, people must stay in their current rental agreements if they have any shot at staying in the city. Landlords recognize this and find loopholes and catalysts to transform their homes into new rental spaces. One resident stated, “Only seven permanent tenants remain in her building, with her landlord ignoring requests for necessary repairs in favor of gut renovations on apartments functioning as illegal hotels.” (Gold, 2019, p. 1596)13. In addition to the changes in living composition, Airbnb often take entire homes off the market, and the most likely communities impacted remain those marginalized. Soon, the wearing down and compilation of forces becomes too much for those standing their ground and looking for a new place to call home where they can afford. Unfortunately, those displaced often continue the cycle whether they intended to or not. “Middle-income residents priced out of a rapidly gentrifying neighborhood might end up moving to a lower-cost neighborhood, which could cause the displacement of low-income residents from their once affordable community.” (Gold, 2019, 1602).
For those elderly citizens who have other family members, many are being forced to move in with them. As mentioned by Newman & Wyly (2006), “most of the displacement is the result of landlords tripling rents who know that a senior’s income doesn’t go up. It stays the same. They have to move in with their kids and can’t go to senior housing because there aren’t any– they are booked.” (p. 46)14. An in-depth study on tracking the displaced reveals how “many community members report that residents often double- or triple-up with family and friends, become homeless, or move into the city shelter system”(Newman & Wyly, 2006, p. 45). When looking at US census data between 2010 and 2022, the trend continues as the rate of citizens 65+ living with others has risen significantly. While some can move in with their children or family, those that do not have any are living alone at disproportionately large rates, and/or are being displaced. This highlights the elderly community as a marginalized group because of gentrification patterns.
Overall, our research has discussed and investigated specific factors that provide a more humanistic perspective into the economic prosperity and disparity Airbnb creates. Although we are just beginning to scratch the surface of the impact of Airbnb on the housing market and the people most affected by it, the research remains stark. Airbnb has no signs of slowing down and no signs of the need for affordable housing to slow down, either. Cities have started implementing inhibitors to the short-term rental boom by making laws against illegal rentals. We hope leveraging datasets like InsideAirbnb with demographic data can help make substantial changes for those they affect the most. By understanding their existence, prevalence, and impact, we can fully acknowledge the problem and start our path toward fixing it.
References
- “New York City.” Inside Airbnb, (2023) insideairbnb.com/new-york-city/. Accessed 10 Nov. 2023. ↩︎
- Stabrowski, Filip (2017). ‘People as businesses: Airbnb and urban micro-entrepreneurialism in New York City. Cambridge Journal of Regions, Economy and Society, Volume 10, Issue 2, July 2017, Pages 327–347, https://doi.org/10.1093/cjres/rsx004 ↩︎
- Törnberg, P., & Chiappini, L. (2020, Jan. 05). Selling black places on Airbnb: Colonial discourse and the marketing of black communities in New York City. Environment and Planning A: Economy and Space. Retrieved Nov. 15, 2023 https://doi.org/10.1177/0308518X19886321 ↩︎
- Kadi, Justin, Plank, Leonhard & Seidl, Roman. (2019, Aug. 22). Airbnb as a Tool for Inclusive Tourism?, Tourism Geographies, 24:4-5, 669-691. Retrieved Nov. 15, 2023 https://www.tandfonline.com/doi/full/10.1080/14616688.2019.1654541 ↩︎
- Shomik, Jane et al. (2021, Apr. 22) “Nowcasting Gentrification Using Airbnb Data.” Proceedings of the ACM on Human-Computer Interaction, vol. 5, no. CSCW1, pp. 1–21. DOI.org (Crossref), Retrieved Nov. 04, 2023 https://doi.org/10.1145/3449112. ↩︎
- Dudas, Gabor et al. (2023). “A Socio-Economic Analysis of Airbnb in New York City.” Researchgate,
https://www.researchgate.net/publication/320443736_A_socio-economic_analysis_of_Airbnb_in_New_York_City.
↩︎ - Lee, Seonjin, and Hany Kim. “Four Shades of Airbnb and Its Impact on Locals: A Spatiotemporal Analysis of Airbnb, Rent, Housing Prices, and Gentrification.” Tourism Management Perspectives, vol. 49, Nov. 2023, p. 101192. DOI.org (Crossref), https://doi.org/10.1016/j.tmp.2023.101192. ↩︎
- Manskar, N. (2018, February 27). These NYC neighborhoods are among nation’s most gentrified. New York City, NY Patch. https://patch.com/new-york/new-york-city/these-nyc-neighborhoods-are-among-nations-most-gentrified ↩︎
- Wachsmuth, David, and Alexander Weisler. “Airbnb and the Rent Gap: Gentrification through the Sharing Economy.” Environment and Planning. A, vol. 50, no. 6, 2018, pp. 1147–70, https://doi.org/10.1177/0308518X18778038. ↩︎
- Benner, Katie. “Airbnb Wants Travelers to ‘live like a Local’ with Its App.” The New York Times, The New York Times, 19 Apr. 2016, www.nytimes.com/2016/04/20/technology/airbnb-wants-travelers-to-live-like-a-local-with-its-app.html. ↩︎
- Cohen, M., & Pettit, K. (2019, April 23). GUIDE TO MEASURING NEIGHBORHOOD CHANGE TO UNDERSTAND AND PREVENT DISPLACEMENT. Urban Institute. Retrieved December 02, 2023, from https://www.urban.org/sites/default/files/publication/100135/guide_to_
measuring_neighborhood_change_to_understand_and_prevent_displacement.pdf ↩︎ - New York City QuickFacts. (2023, September 07). U.S. Census Bureau QuickFacts: New York city, New York. Retrieved December 06, 2023, from https://www.census.gov/quickfacts/fact/table/newyorkcitynewyork/PST045222 ↩︎
- Gold, A. E. (2019). COMMUNITY CONSEQUENCES OF AIRBNB. Washington Law Review, 94(4), 1577-1637. https://www.proquest.com/scholarly-journals/community-consequences-airbnb/docview/2355875432/se-2 ↩︎
- Newman, K., & Wyly, E. K. (2006, Jan. ). The Right to Stay Put, Revisited: Gentrification and Resistance to Displacement in New York City. Urban Studies, 43(1), 23-57. https://doi.org/10.1080/00420980500388710 ↩︎